Decode the dashboard : Numbers speak volumes
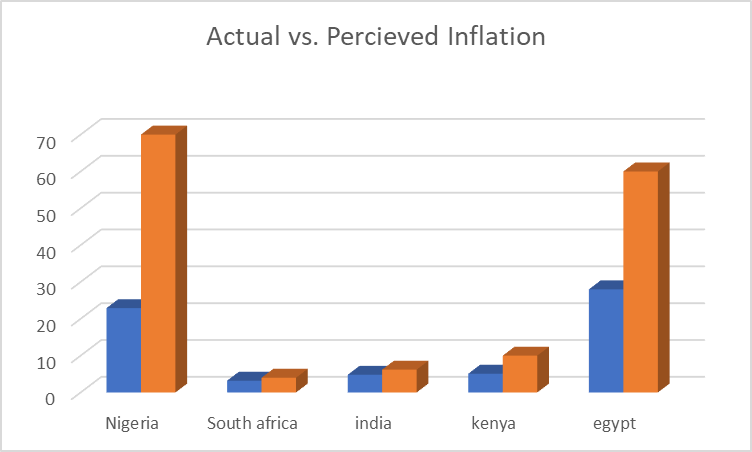
Inflation perception vs. actual inflation
| Country | Actual Inflation (2025) | Perceived / Expected Inflation (2025) | Reasons for Actual Inflation | Reasons for Perceived Inflation (How People Feel It Differently) |
| 🇳🇬 Nigeria | ≈ 22.9 % (NBS, May 2025) | ≈ 65–70 % perceive prices as “very high” (CBN IES survey) | Persistent naira depreciation, fuel subsidy removal, rising food & energy costs; imported inflation from weak FX reserves. | Households face steep price hikes in food and transport daily, far beyond CPI averages; distrust in official data after years of inflation under-reporting; emotional memory of price shocks inflates perception. |
| 🇿🇦 South Africa | ≈ 3.2 % (SARB projection) | ≈ 4.0 % expected (Bureau for Economic Research, July 2025) | Stable monetary policy, lower oil import costs, strong rand, and easing food prices. | Consumers recall 2022–23 high inflation period and remain cautious; load-shedding costs make essentials feel pricier than data shows; wage stagnation exaggerates cost-of-living perception. |
| 🇮🇳 India | ≈ 4.8 % (MOSPI, mid-2025) | ≈ 6.2 % expected (RBI household survey) | Stable supply chains, good harvests, but core inflation from housing and services persists. | Food and fuel prices vary sharply by region; citizens focus on volatile essentials like vegetables and transport rather than overall CPI; media coverage amplifies short-term spikes. |
| 🇰🇪 Kenya | ≈ 5.1 % (KNBS, Q2 2025) | ≈ 9–10 % perceived (local polls, 2025) | High electricity tariffs, shilling depreciation, and imported grain/fertilizer costs. | Urban households over-estimate inflation due to visible price jumps in maize meal and matatu fares; salary delays make prices feel heavier; perception shaped by cash-flow stress. |
| 🇪🇬 Egypt | ≈ 28 % (CAPMAS, 2025) | ≈ 60 %+ perceived (local opinion polls) | Currency devaluation, subsidy cuts, and IMF reform measures; high import dependency. | Rapid monthly price changes create “anchoring bias”; people compare today’s prices to last year’s, not the CPI base; scarcity magnifies emotional inflation. |
Synthesis: The “Empathy Gap” in Inflation Data
In emerging and low-income economies, actual inflation measures the market, but perceived inflation measures the mind.
This gap widens where trust in data is low, incomes are irregular, and essentials (food, fuel, rent) dominate daily expenditure.
For policymakers — and reflective economists like Nehal — this reveals why “living data” matters: economic dashboards must capture both numerical truth and human truth.
“When citizens stop believing the numbers, inflation stops being just an index — it becomes an emotion.” — Nehal
